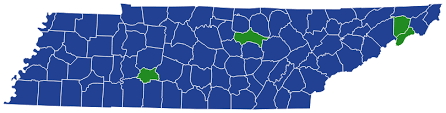
Tennessee is somewhat more diverse than Indiana, but both states sit well below the national average on the U.S. Census Bureau’s diversity index. In the 2020 Census, Tennessee scored 46.6% and Indiana 41.3%, compared with about 61.1 percent for the country as a whole. Tennessee’s lead comes mainly from its larger Black population, concentrated in Memphis and Nashville, while Indiana has a slightly larger Hispanic share and one of the most distinctive refugee communities in the Midwest.
Here is what the index measures, how the two states compare, and where their diversity is concentrated, city by city.
How the Diversity Index Works
The Census Bureau’s Diversity Index (DI) measures the chance that two people chosen at random from an area belong to different racial or ethnic groups. It runs from 0 to 100. A low score means most people belong to one group; a high score means the population is spread across several groups.
The calculation uses the census race and Hispanic origin categories: Hispanic or Latino, plus non-Hispanic White, Black, Asian, American Indian and Alaska Native, Native Hawaiian and Other Pacific Islander, some other race, and multiracial.
Some things to keep in mind:
- In states where one group is a large majority, as non-Hispanic White residents are in both Tennessee and Indiana, the index tends to be low even if cities are quite diverse.
- The index does not show national origin within a group. Kurdish, Burmese or Somali communities, for example, show up only as part of broad race categories.
- The 2020 Census used improved coding for race responses, which increased the multiracial count and raised scores nationwide. The U.S. index rose from 54.9% in 2010 to 61.1% in 2020, partly for this reason.
Tennessee vs Indiana at a Glance
| Measure | Tennessee | Indiana |
|---|---|---|
| Population (2020 Census) | About 6.91 million | About 6.79 million |
| 2020 diversity index | 46.6% | 41.3% |
| Non-Hispanic White share | Around 70% | Around 75% |
| Black share | Around 16% | Around 9–10% |
| Hispanic or Latino share | Around 7% | Around 8% |
| Asian share | About 2% | About 2–3% |
| Main diversity hubs | Memphis, Nashville | Indianapolis, Lake County |
These are rounded approximations from Census Bureau data, for comparison only. The exact index values — 46.6% and 41.3% — are the Census Bureau’s published 2020 figures.
The takeaway: Tennessee’s larger Black population gives it the edge, while Indiana’s Hispanic and Asian shares are similar or slightly larger. Both states are growing, and both are gradually becoming more diverse.
Diversity in Tennessee
Tennessee is often described as three states in one: East, Middle and West Tennessee. Diversity follows that divide closely.
Memphis and West Tennessee
Memphis is a majority Black city, roughly six in ten residents, and one of the most important centers of Black history and culture in the South. It is where Martin Luther King Jr. was assassinated in 1968, now marked by the National Civil Rights Museum, and it gave the world a huge share of blues, soul and early rock and roll through Beale Street, Stax Records and Sun Studio. Shelby County also has a growing Hispanic population, especially in southeast Memphis.
Nashville and Middle Tennessee
Nashville has become one of the South’s most important immigrant destinations. It has the largest Kurdish community in the United States, centered around the “Little Kurdistan” area along Nolensville Pike, along with sizable Somali, Egyptian (including Coptic Christian), Mexican, Honduran, Guatemalan, Bhutanese and Burmese communities. Antioch and the Nolensville Pike corridor in southeast Nashville are among the most diverse parts of the state, with many languages spoken in local schools.
East Tennessee
Knoxville and Chattanooga have growing Black and Hispanic communities, but much of rural East Tennessee, part of Appalachia, remains overwhelmingly non-Hispanic White. Those counties pull the statewide score down.
Diversity in Indiana
Indiana’s diversity is concentrated in a few places: Indianapolis, the northwest corner near Chicago, and several manufacturing towns in the north.
Indianapolis and the Chin Community
Indianapolis is Indiana’s most diverse city, with a large Black community and growing Hispanic and Asian populations. It is also home to one of the largest Burmese Chin communities outside Myanmar, with tens of thousands of residents on the south side, especially in Perry Township and Southport. Chin families began arriving in large numbers as refugees in the 2000s, and today the community has its own churches, grocery stores and community organizations.
Northwest Indiana
Lake County, across the state line from Chicago, is one of the most diverse counties in Indiana. Gary is majority Black, and East Chicago and Hammond have large Hispanic populations, many with Mexican and Puerto Rican roots tied to the steel industry.
Northern Indiana Towns
Elkhart, Goshen and nearby towns have large Hispanic communities that grew with the RV and manufactured-housing industries. The same region, especially Elkhart and LaGrange counties, has one of the largest Amish populations in the country. The census counts Amish residents as White, but their language (Pennsylvania German) and way of life give the area a strong cultural identity that the diversity index does not capture.
Why Tennessee Scores a Little Higher
- Tennessee’s Black population is roughly one and a half to two times larger as a share of the state.
- Memphis alone adds a large, majority Black metro area; Indiana has no metro area that is majority Black.
- Indiana’s somewhat larger Hispanic share narrows the gap, but not enough to close it.
- Both states have large, mostly White rural regions that keep statewide scores low.
What the Numbers Mean for Residents
Low statewide scores can hide significant change at the local level. In Nashville and Indianapolis, school districts now serve students who speak dozens of home languages, and interpreters and translated materials have become routine in hospitals and government offices. Employers in both states, especially in manufacturing, logistics and healthcare, increasingly rely on immigrant and refugee workers. At the same time, many rural counties have seen little demographic change, which can create very different experiences of the same state.
How to Check Your Own County’s Score
If you live in either state, the statewide number probably tells you less than your county’s. A simple way to see local figures:
- Search the Census Bureau’s 2020 Census data visualizations for the diversity index map, which lets you zoom to any county.
- Compare your county with its neighbors. In Tennessee, Shelby and Davidson counties stand out; in Indiana, Lake and Marion counties do.
- Look at the race and Hispanic origin breakdown behind the score, since two counties with the same index can have very different mixes.
- Use American Community Survey five-year estimates for smaller towns, keeping the margins of error in mind.
Following Local News in Each State
Census numbers are a snapshot. To follow what is actually happening in communities, local news and press platforms are useful. Tennessee PR Local publishes news and releases from around Tennessee, helpful for tracking business openings, cultural festivals and community programs from Memphis to Knoxville.
For Indiana, Indiana PR Catalogs covers state news and announcements, useful for following organizations and events in Indianapolis, northwest Indiana and smaller cities.
When reading any diversity data, check whether it comes from the decennial census or the American Community Survey, which year it covers, and whether it describes the whole state or a specific county or city.
What to Watch Next
Both states are growing and gradually diversifying. Nashville’s immigrant communities keep expanding, and Indianapolis’s south side continues to absorb new refugee arrivals. The 2024 federal update to race and ethnicity standards, which merges the race and Hispanic origin questions and adds a Middle Eastern or North African category, will also change how future scores are produced — the 2030 Census will be the first decennial count to use it.
For more pairings, read Ohio vs Georgia for a much wider gap, or Wisconsin vs Colorado. The full series lives in the Daily Bites category.
The Bottom Line
Tennessee (46.6%) edges Indiana (41.3%) on the 2020 diversity index, and the reason is simple: Tennessee’s Black population is much larger as a share of the state, anchored by majority-Black Memphis. Indiana’s diversity is more concentrated — Indianapolis, Lake County and the RV towns of the north — and its distinctive Chin and Amish communities barely register in the index at all. In both states, the statewide score understates how diverse the big cities have become.
Frequently Asked Questions (FAQs)
Is Tennessee more diverse than Indiana?
Yes, slightly. Tennessee scored 46.6% on the 2020 Census diversity index, Indiana 41.3%. Both are well below the national figure of 61.1%.
What is the most diverse city in Tennessee?
Memphis, which is majority Black, with Nashville close behind on the strength of its immigrant communities. At the county level, Shelby and Davidson counties stand out.
Why do so many Burmese people live in Indianapolis?
Chin families from Myanmar began arriving in Indianapolis as refugees in the 2000s, settling mainly on the city’s south side. Chain migration — relatives joining earlier arrivals — built one of the largest Chin communities outside Myanmar.
What is the most diverse county in Indiana?
Lake County, in the northwest corner near Chicago, is one of the most diverse; Gary is majority Black and East Chicago and Hammond have large Hispanic populations. Marion County (Indianapolis) is the other main hub.
Does the diversity index count Amish communities separately?
No. The census counts Amish residents as White, so their distinct language and way of life do not raise the index, even in counties like Elkhart and LaGrange where they are a large presence.
Where can I find exact diversity index figures?
The Census Bureau publishes 2020 diversity index values for every state and county through its data visualizations and data.census.gov.